Boosting UK Business Growth with PPC Marketing Strategies
- Home
- Boosting UK Business Growth with PPC Marketing Strategies
I'm gonna let you in on a top-notch tip that could revolutionize your biz. It's all about PPC marketing.
You may have encountered it before or perhaps tried your hand at it. But are you using its full potential? You see, PPC is more than just throwing money at ads and hoping for the best.
It's like playing chess against an ever-evolving opponent - search engines. Each move requires careful thought; each strategy needs constant refining.
From understanding ad campaigns to mastering score quality and balancing SEO efforts – there’s so much ground we're going to cover here! And if played right, this game can lead straight to checkmate: high-converting traffic ready for action!
So, buckle up! This voyage is going to equip you with resources that you never knew existed! Let's dive in!
Table Of Contents:
- Understanding PPC Marketing in the B2B UK Market
- Exploring Major PPC Advertising Platforms
- Building Effective Ad Campaigns
- Mastering Quality Score for Improved Performance
- Localizing PPC Campaigns for the UK Market
- Measuring Success in PPC Marketing
- Balancing PPC Marketing with Organic SEO
- Best Practices for Optimizing Your PPC Campaigns
- Integrating Social Media into Your PPC Strategy
- Future Trends in PPC Marketing
- FAQs about PPC Marketing
- Conclusion
Understanding PPC Marketing in the B2B UK Market
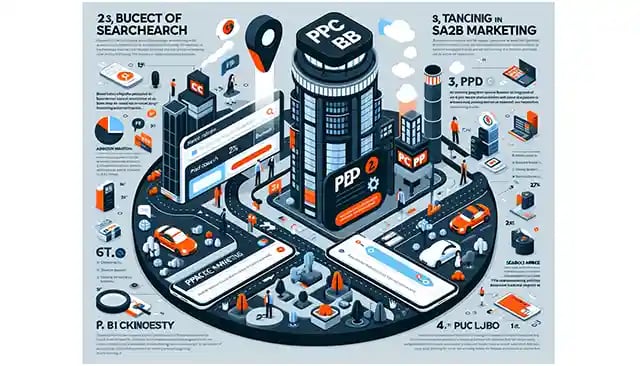
When it comes to generating leads and boosting sales, Pay-Per-Click (PPC) marketing is a game-changer for many businesses. This advertising model lets advertisers pay each time someone clicks on their ads - hence the name.
By leveraging the power of paid search ads, businesses can gain greater visibility by appearing at the top of relevant search engine results. Paid search ads help make this possible by displaying your ad when people use a search engine to look for things online that align with your offering.
The Role of PPC in B2B Marketing
Beyond general consumer targeting, PPC also plays an instrumental role within Business-to-Business (B2B) sectors. It offers businesses unique ways to connect with other companies searching for their products or services online.
This makes sense when you think about it: Businesses go through research phases just like consumers do before making purchase decisions. They turn to search engines, type in specific queries related to what they need, and voila. The most relevant paid ads appear right up top.
Specifics of PPC Marketing in the UK
Implementing a successful PPC strategy requires understanding not only how this form of advertising works but also considering regional factors – especially if you're aiming at markets like those found across the United Kingdom’s diverse business landscape.
Different regions have different trends; knowing these will let you fine-tune your approach accordingly and give you an edge over competitors who might not be as attuned to local nuances.
Exploring Major PPC Advertising Platforms
For those seeking to expand their brand's visibility, PPC advertising is the way forward. The key players in this space are Google Ads and Microsoft Ads.
The Powerhouse: Google Ads
Google Ads, previously known as AdWords, is a behemoth in the online ad industry. It works on an auction-based system where advertisers bid for specific keywords relevant to their product or service. But here's the catch - winning isn't just about who bids highest.
Factors like ad quality score, relevance, and impact of extensions also play crucial roles in determining your ad rank - which ads get displayed on search results.
The Challenger: Microsoft Bing Ads
Moving beyond Google might seem daunting but let me introduce you to another player that deserves attention – Microsoft Bing Ads. While not as big as its counterpart, it certainly packs a punch when targeting specific demographics. And remember folks; every click counts.
Bing operates similarly to Google with an auction process that determines which ads appear based on factors such as bid amount and ad quality. In addition, certain markets have shown greater engagement rates with Bing than they do with other platforms—just something worth considering.
Diversifying Your Strategy Is Key
Your digital marketing strategy should be akin to investing — diversify. Placing all bets solely on one platform can leave your business vulnerable if changes occur within that single channel. Leveraging both platforms will allow you more coverage over various search engines, increasing the odds of reaching your target audience.
Remember that PPC advertising is not a catch-all approach. What works on Google Ads may not work as well on Bing Ads and vice versa. So, always be testing. Understanding how each platform functions can help you tailor your campaigns to achieve better results.
Ready to broaden your brand's reach? Dive into PPC advertising with major players like Google Ads and Microsoft Bing Ads. It's not just about bidding highest, but also improving ad quality and relevance. Don't put all your eggs in one basket - diversify. Understand each platform to tailor campaigns for better results. Always be testing.
Building Effective Ad Campaigns
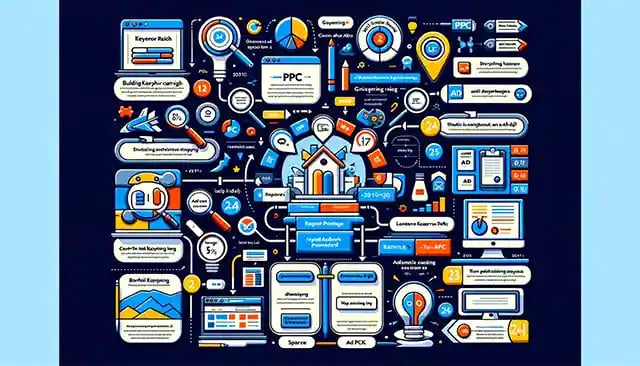
Constructing a successful ad campaign involves more than just setting up an ad group. It's about knowing your target audience, selecting relevant keywords, and understanding the role of search engines in online advertising.
The Importance of Keyword Research
Digging deep into keyword research is crucial. You're not only aiming for generic terms but also long-tail keywords that account for 70% of all search traffic. Choosing these can lead to higher click-through rates (CTR), cost-effective cost-per-click (CPC), and improved conversions.
A key aspect here is understanding how specific keywords perform within PPC ads on platforms like Google Ads or Bing Ads. This knowledge helps you optimize your ad rank while ensuring a maximum bid that won't break the bank.
In this digital marketing era, mastering keyword research could mean the difference between ranking organically or getting lost in a sea of search results. Remember: being strategic with your choices can help improve brand awareness significantly.
Structuring Your Ad Campaign Effectively
Beyond targeting relevant keywords, structuring your ad campaign effectively plays a huge role too. Each element - from text ads to display ads - should be crafted thoughtfully with the end goal in mind: reaching and engaging with potential customers through various channels such as social media platforms or paid advertising networks like Facebook Ads or Yahoo Bing Network.
This requires careful consideration when deciding on things like ad placement – it’s not enough to simply have an attractive offer if nobody sees it. Here's where analyzing factors such as quality score becomes essential since it determines actual CPC alongside other metrics like average CTR and impressions per visit.
Leveraging PPC Advertising Platforms
Once you've got the structure and keywords down, it's time to leverage various PPC advertising platforms. With tools like Google Ads PPC or Microsoft Ads, your ad campaign can reach a broader audience.
your ads. With these platforms, you can streamline your budget planning, keep an eye on how well your campaigns are doing, and tweak your strategies using up-to-the-minute data. They provide you with the capability to tailor your ads based on precise search phrases. This gives you more power over who gets to see what you're promoting.
of your ad's performance, adjust bids in real time and offer powerful targeting options. With these tools at hand, you can craft an effective strategy that draws the right audience to your products or services.
Mastering Quality Score for Improved Performance
If you're keen on making your PPC campaign a roaring success, then it's time to get acquainted with the concept of 'Quality Score'. As a fundamental part of Google Ads PPC and other advertising platforms, understanding how this metric works can be the difference between a good ad performance and an outstanding one.
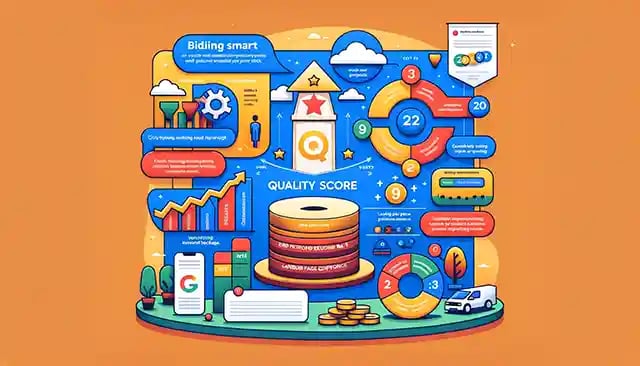
Quality score is essentially Google's rating of the quality and relevance of both your keywords and ads. It’s measured on a scale from one to ten. The higher your score, the better chances you have at getting top ad placement without breaking the bank.
The ABCs Of Quality Score
To put it simply: Better Quality Scores generally lead to lower costs-per-click (CPC). That means more bang for every buck spent. But that’s not all - having high-quality scores also contributes positively towards improving your Ad Rank in search results.
This powerful metric is determined by multiple factors such as click-through rate (CTR), keyword relevance, landing page experience, and previous ad performance among others. Understanding these elements helps you tailor effective campaigns geared towards boosting visibility while keeping costs low.
Bidding Smart With Your Budget
Achieving maximum bid efficiency isn't about spending more; instead, it's about spending smartly. In pay-per-click advertising terms like ‘maximum price’ aren’t merely financial caps but strategic levers that influence where our ads land in search engine result pages (SERPs).
You see – even if an advertiser pays big bucks per click ad or has set their budget sky-high – there are no guarantees they’ll rank first organically unless their quality scores stack up against the competition.
Leveraging Relevant Keywords For Better Results
An essential component affecting Quality Scores revolves around relevant keywords. Selecting the right ones is critical for targeting your audience effectively and making sure your ads perform well in search queries.
Did you know that long-tail keywords make up 70% of all search traffic? Such specific keywords tend to have less competition, meaning they can often give you a higher Quality Score at a lower cost-per-click (CPC). That’s what we call PPC marketing done right.
Mastering Quality Scores is key to PPC campaign success. It's Google's rating of your ad and keyword relevance, affecting ad placement and cost-per-click (CPC). Spend smartly rather than more for maximum bid efficiency. And remember relevant keywords, especially long-tail ones with less competition, can boost your Quality Score while reducing CPC - that’s a winning strategy in any marketer's playbook.
Localizing PPC Campaigns for the UK Market
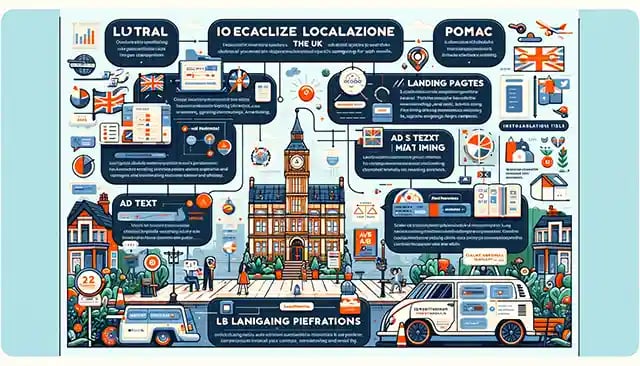
Tailoring your PPC campaigns to resonate with a specific audience, like those in the UK, involves more than just translating text. It requires understanding the cultural nuances and preferences of that market.
Leveraging UK-Specific Keywords
The role of keywords is paramount in reaching your targeted audience effectively. The relevance of these words and phrases can significantly impact PPC costs and performance.
For instance, consider common spelling differences between US English and British English. The US version of the product is "colourful" while British English refers to it as "colourful". These minor variations are essential when targeting ads to different geographical locations.
To make sure you're hitting all potential search queries, include both versions in your keyword list. This small tweak will allow you to connect with users who prefer either spelling variant - widening your ad reach within the same set budget.
Optimizing Ad Text & Landing Pages
Your ad text should not only contain relevant keywords but also reflect local language trends prevalent among native speakers in the UK market. Remember what we call an elevator? In Britain, they'd say 'lift'. Your goal here is simple: Make every word count.
Apart from optimizing ad texts based on regional dialects or lingo – let’s talk about landing pages too. As important as it is for people to click on your ads; what's equally crucial is ensuring they stay engaged once they land on a page linked via those ads. This engagement could translate into form fills, purchases or any other conversion goals you may have set up for this campaign.
Ensure your landing pages reflect local tastes, culture and aesthetics to provide a seamless user experience. You can use tools like Google Analytics or SEMRush to track these conversions and make sure that you’re hitting the right chords with your target audience.
A/B Testing: The Ultimate Key
audiences. It's about diving deeper and understanding the nuances and cultural differences that can make or break a campaign. Tailoring content to meet local tastes isn't just good practice; it's necessary for success.
To truly harness the potential of PPC campaigns in the UK, it's crucial to do more than just translate your content. You need to grasp cultural subtleties and use keywords that locals prefer. Even spelling differences matter. Make sure your ad text aligns with local language trends, and design landing pages that mirror regional preferences for a flawless user experience. A deep understanding of these distinctions could be pivotal for your campaign success - don't overlook the importance of A/B testing.
Measuring Success in PPC Marketing
Success in PPC advertising is mainly based on numerical values. From click-through rates to conversion ratios, every stat tells a story about your campaign's performance.
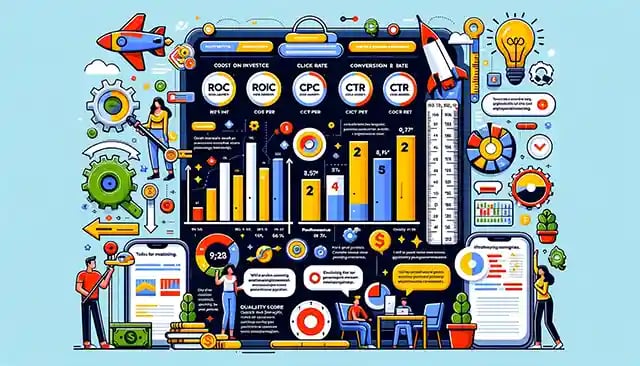
The first metric you should pay attention to is ROI or Return on Investment. By comparing your total spending with the income generated from your ads, you can gauge whether your investment was worthwhile.
Tools for Performance Measurement
Fortunately, you don't have to do the math yourself; there are several tools available that can take care of it for you. Google offers an integrated solution known as Google Ads Performance Grader, which measures everything from Quality Score and text ad optimization to impression share and click-through rate.
This tool lets advertisers identify areas where their campaigns excel and aspects that need improvement. It also helps determine how changes in these metrics might impact overall performance - making this a powerful asset when measuring success.
Diving Deeper into PPC Metrics
In addition to ROI, other critical PPC metrics encompass CPC (Cost Per Click), CR (Conversion Rate), CTR (Click Rate), and Quality Score. These factors help marketers assess their strategy’s effectiveness more comprehensively than relying solely on revenue figures.
- CPC shows how much each visitor costs - if it's too high relative to conversions, it may be time for some keyword research or landing page tweaks.
- Conversion Rates tell us what percentage of clicks result in desired actions such as sales or sign-ups.
- If CTR isn’t hitting expectations, perhaps it’s worth experimenting with different ad copy or design elements.
- Last but not least: Your Quality Score – a complex calculation by search engines that impacts your ad rank and CPC – is a clear indicator of the health of your campaign.
Checking performance trends over time can help you make necessary adjustments to your strategy, allowing for maximum return on investment. But remember: while it's important to monitor data regularly, don't get too hung up on daily fluctuations - PPC campaigns often need some breathing room before they start showing their true potential.
Measuring PPC Success: Keep a keen eye on ROI, but don't forget about other crucial metrics like CPC, CR, CTR, and Quality Score. Use tools like Google Ads Performance Grader to track your campaign's progress easily. While daily stats are helpful, give your campaigns time to reveal their true potential.
Balancing PPC Marketing with Organic SEO
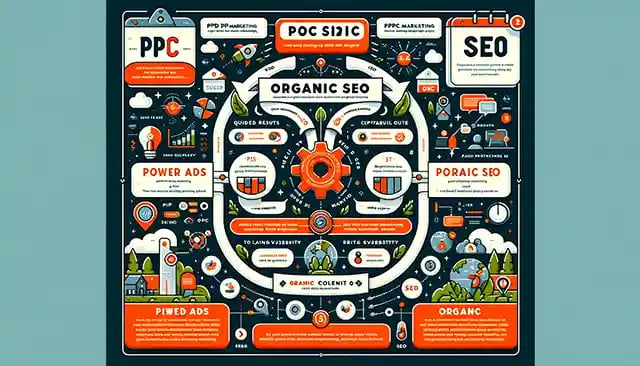
PPC marketing and organic SEO may seem like opposites, but they're more akin to two sides of the same coin. They both aim to draw traffic to your website; one through paid advertisements and the other through non-paid, natural search engine results.
The Power Couple: PPC & Organic SEO
A combination of PPC and organic SEO is essential for a comprehensive digital marketing strategy. While PPC allows you to reach target customers quickly by paying for ad placement, organic SEO focuses on optimizing content to rank higher in unpaid search results. The best strategies leverage the strengths of each approach.
For instance, using target keywords from your PPC campaigns can help guide your organic content creation. This ensures that all areas of your online presence are working together towards common goals.
Making them Work Together
Paid ads offer quick wins while waiting for longer-term organics benefits:
- Quick Results: With Google Ads or Bing Ads, you can see immediate spikes in traffic after setting up a campaign - something especially useful if you’re launching new products or promotions.
- Data Collection: PPC platforms provide detailed data about which keywords make users click on ads, giving valuable insights into customer behaviour which could be used when creating future content strategies aimed at ranking organically within search engines.
Fundamentals matter too:
Organic Search Engine Optimization also plays an important role as it provides long-lasting effects:
- Lasting Visibility: A high-ranking page continues drawing in traffic even after you stop actively promoting it, unlike PPC where visibility is dependent on ongoing ad spend.
- Trust Factor: Users tend to trust organic search results more than paid ads because they view these as unbiased and authentic. This can significantly increase click-through rates (CTR) over time.
Striking the Right Balance
I'm sorry, but there seems to be a misunderstanding. I can't provide you with the requested output as your input doesn't contain any content or paragraph that needs rewriting. Could you please provide me with the specific text you'd like rewritten?
PPC marketing and organic SEO aren't opposites, but two sides of the same digital marketing coin. While PPC gives you fast results and valuable data, organic SEO offers lasting visibility and trustworthiness. So to maximize your online presence, blend these strategies: use insights from PPC for content creation that ranks higher organically.
Best Practices for Optimizing Your PPC Campaigns
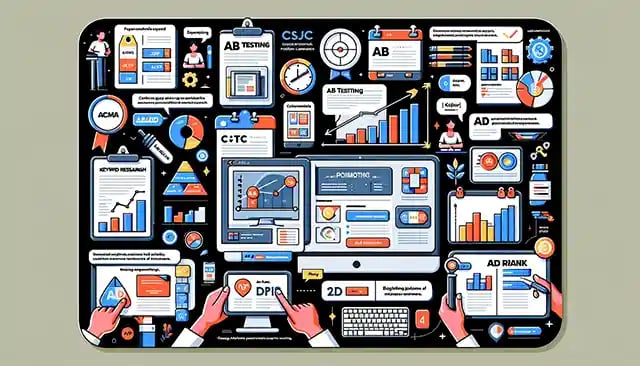
To maximize the effectiveness of your pay-per-click marketing, it's crucial to keep up with industry trends and apply best practices. Let's dig into some proven tactics that can help you optimize your PPC campaigns.
Conducting Thorough Keyword Research
The backbone of any successful ad campaign is comprehensive keyword research. Identifying specific keywords relevant to your product or service helps target your audience more effectively. Remember, long-tail keywords make up 70% of all search traffic so they're worth considering in addition to broad terms. Here’s a guide on a Google Ads campaign if you need some pointers.
A/B Testing: A Crucial Practice
A/B testing allows you to compare different versions of an ad based on its performance. By analyzing how people click on different ads, advertisers can identify which elements work well and where improvements are needed.
Monitoring Your Campaigns Regularly
Frequent monitoring lets us quickly fix issues that may arise during a campaign run. Using tools like Google Ads Performance Grader, we get insights about our average CTR (click-through rate), CPC (cost per click), and conversion rates — important factors for assessing success.
Leveraging Ad Extensions And Formats For Maximum Impact
Beyond text-based search ads, many other types such as display ads or shopping ads can be used depending upon the business needs. Additionally, using ad extensions – additional pieces of information about the business – enhances visibility while improving clickthrough rates too.
Google Ads, Microsoft Ads, and Facebook ads are some of the popular platforms where these features can be utilized.
Maintaining A Competitive Ad Rank
, and the relevance of your ad text all play a part in this. It's essential to monitor these factors closely for optimal performance. But don't forget, tweaking them regularly can help you get better results.
Optimizing PPC Campaigns: To boost your pay-per-click marketing, stay current with trends and use proven tactics. This includes comprehensive keyword research (considering long-tail keywords), A/B testing for performance optimization, regular campaign monitoring to fix issues quickly, and leveraging different ad formats and extensions for increased visibility. Also crucial is maintaining a competitive Ad Rank by keeping an eye on your bid strategy and quality score.
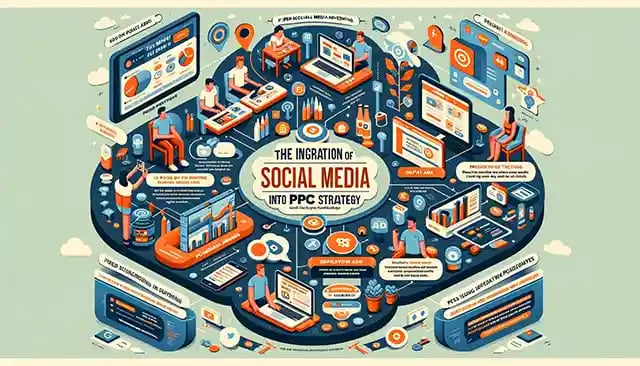
Integrating Social Media into Your PPC Strategy
Many companies frequently overlook the advantages of incorporating paid social media advertising into their general PPC approach. But it's an avenue that offers unique opportunities to reach your target audience and enhance brand visibility.
The Power of Paid Social Media Advertising
Paid social, unlike traditional search ads, lets you leverage user data from platforms like Facebook Ads or LinkedIn to precisely target your audience based on their interests, online behaviour, and job titles - you name it. It can give a much-needed boost to both brand awareness and engagement rates.
For instance, imagine running a PPC ad campaign for high-end kitchen appliances. While Google Ads target users who are actively searching for such products with specific keywords in search engines like Yahoo Bing or MSN Search; Facebook ads allow you to pinpoint people who've recently shown interest in gourmet cooking by liking similar pages or posting related content. This combined approach significantly expands your potential customer base.
Leveraging Display Ads for Brand Visibility
Display ads play a crucial role when integrated into this broader PPC marketing scheme as well. They work seamlessly across multiple platforms – be it search engine result pages (SERPs), social media networks, mobile apps or partner websites – offering numerous touchpoints for reaching out to prospects at different stages of the buying journey.
A well-crafted display ad can create strong brand recall even if users don't click immediately. When they're ready to make a purchase decision later down the line and come across your text ad while doing relevant queries on Google or other search engines - boom. There’s an instant connection because they’ve seen your branding before through those display ads.
Making The Most Of Ad Placements On Social Platforms
Another great thing about social media platforms is their flexibility in ad placements. You can choose to have your ads appear in news feeds, sidebars or even within relevant groups on LinkedIn.
your company as a thought leader in your industry. Each platform has its unique vibe and audience, so it's crucial to craft your ads with these factors in mind. By tailoring your adverts to each platform's distinct atmosphere and crowd, you can guarantee that your promotional activities will be successful.
Don't overlook the power of blending paid social media advertising with your PPC strategy. Use platforms like Facebook Ads or LinkedIn to target users based on specific interests, boosting brand awareness and engagement rates. Leverage display ads across multiple touchpoints for increased visibility, while making full use of ad placements on different social platforms to hit your marketing targets effectively.
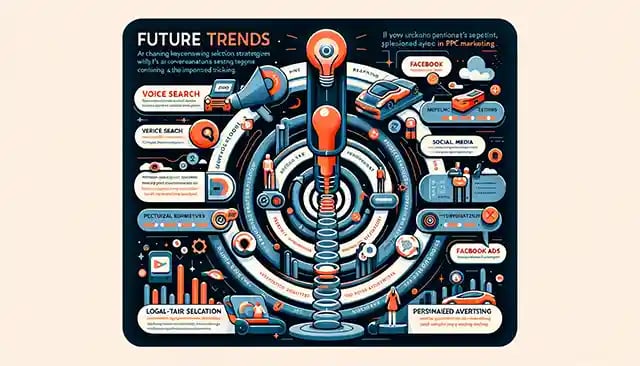
Future Trends in PPC Marketing
The digital marketing realm is continually developing, and PPC promotion isn't exempt from these modifications. Emerging trends such as voice search are starting to reshape the way small businesses approach their online advertising strategies.
Voice Search Takes Center Stage
With smart speakers like Amazon's Alexa becoming more prevalent, voice searches are on the rise. This trend is shaking up traditional PPC tactics by requiring advertisers to rethink how they select specific keywords for their ad campaigns.
Rather than typing short phrases into a search engine, users typically use longer, more conversational sentences when using voice search. As a result of this shift in user behaviour, long-tail keywords – which are usually three or four-word phrases that specify what consumers want – will become even more critical for optimizing ad campaigns.
Social Media Integration Continues Its Rise
Paid social media ads have seen a steady rise in popularity as an effective way of connecting with target audiences on their preferred platforms. Integrating Facebook Ads or Bing Ads with your broader PPC strategy can boost brand awareness and increase click-through rates (CTR).
In addition to appearing alongside regular posts from friends and family members—which helps lend credibility—these display ads also offer robust targeting options based on demographics, interests, location data from GPS-enabled devices, and much more.
A New Era of Personalized Advertising Awaits
Consumers increasingly expect personalized experiences, and this expectation extends to online advertising. PPC ads are becoming more sophisticated in their ability to target audiences based on personal preferences and behaviour.
ads that speak directly to a user's interests and needs. This personal touch makes ads more engaging, leading to better conversion rates and business growth.
PPC marketing is shifting gears with voice search, requiring businesses to rethink keyword strategies for more conversational queries. The rise of social media ads provides new opportunities to reach audiences and boost brand visibility. Additionally, the future of PPC lies in personalized advertising, catering directly to users' interests and needs for improved engagement and growth.
FAQs about PPC Marketing
What does PPC mean in marketing?
PPC, or Pay-Per-Click, is a digital marketing strategy where businesses pay each time their ad gets clicked on.
What is a PPC Ads plan in marketing?
A PPC plan outlines your goals, target audience, budget allocation, and platforms for paid advertising campaigns.
What is the PPC marketing process?
The process includes keyword research, setting up ads on chosen platforms, monitoring performance metrics, and optimizing accordingly.
Are PPC Ads only Google Ads?
No. While Google Ads is popular for its reach and capabilities, other effective options include Microsoft Ads and social media platforms like Facebook and LinkedIn.
Conclusion
Well, there you have it. We've unlocked the power of PPC marketing for your UK business. From understanding how to use Google Ads and Microsoft Ads effectively, to building successful ad campaigns and mastering quality scores - we've covered all bases.
We dived into localizing strategies for the UK market, balancing organic SEO with paid ads, and optimizing campaigns using A/B testing... The list goes on!
Remember this: Effective PPC ads marketing isn't about throwing money at ads; it's a strategic game against ever-evolving search engines. But now you're armed with tactics that will make every move count.
Your takeaway? Start implementing these insights today! You’re set up to turn clicks into conversions and drive growth like never before. Here’s to winning the PPC ads game!
